
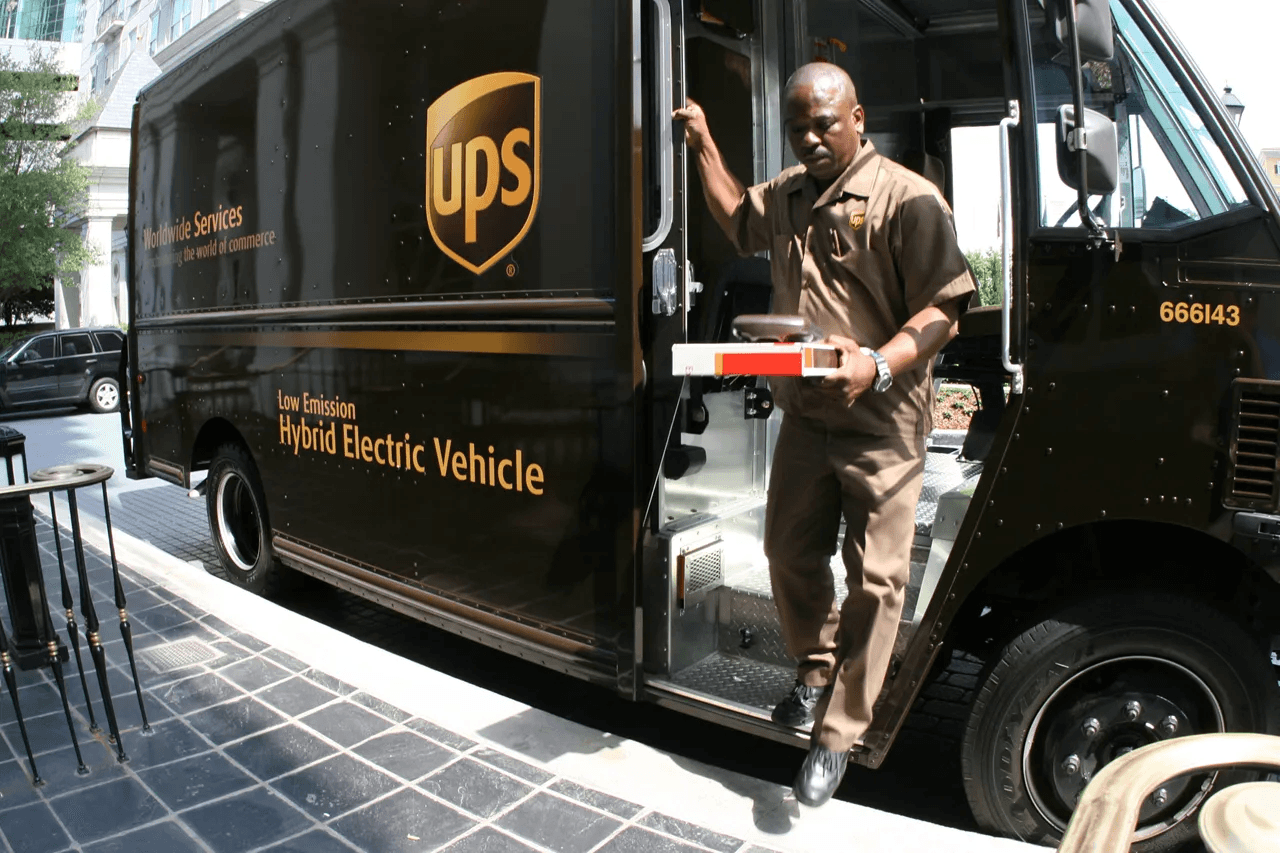
UPS Business Dashboard for Small Business
How might we enhance the shipping experiences of small business owners who work from home?
Industry Sponsor
Mixed-Method Research
Exploratory Research
Evaluative Testing
Web Design
Data Analysis
CLIENT
United Parcel Service (UPS)
ROLE
Lead UX Researcher
DURATION
Aug. 2023 - Dec. 2023
(4 Months)
TEAM
2 UX Designers
2 UX Researchers
1 Project Manager
METHODS
Website Walkthrough
Semi-Structured Interviews
Survey
Competitive Analysis
Contextual Inquiry & Task Analysis
Background
This project, sponsored by UPS.com dashboard team, investigates how UPS could optimize the shipping operations for micro and small enterprises (MSEs) that operate out of their homes.
The Business Objective
Uncover competitive gaps in the current UPS.com shipping experience that causes friction for MSEs and systematically migrate them to alternative platforms
The Research and Design Goal
Identify, redesign and validate a digital solution on the website that fosters a direct touchpoint between UPS and small business owners in their shipping needs
RESEARCH PROCESS
Problem Statement
How might we help micro and small enterprises (MSEs) operate end-to-end shipping and logistics out of their homes, through fostering direct relationships with carriers?
RQ1
How do MSEs currently engage in shipping and logistics out of their own homes?
RQ2
What do MSEs operating out of homes value in the shipping and logistics provided by carriers?
RQ3
What constraints do MSEs face in handling their shipping and logistics independently?
RQ4
What goals motivate MSEs to make certain decisions within the shipping and logistics process?
Competitive Analysis
Website Walkthrough
Contextual Inquiry & Task Analysis
User & Stakeholder Interview
Survey
Exploratory Research
Site Analysis
Comparative Analysis
Contextual Inquiry
Stakeholder Interviews
Survey
User Interviews
Site Analysis
Information Goals
Review the structure and information architecture of UPS websites
Have a thorough understanding of the paths and steps to completion of tasks within the UPS website, to expose areas in which to increase user engagement and experience
Process
Team members dissected the official UPS.com website (not stores) and watched comparable walkthroughs on Youtube to learn how micro and small businesses use UPS
Method of Analysis
We examine the relationship between different pages and discussed if the UPS website provides a reasonable paths to pointed user tasks with the use of an Interaction Map
Findings
Information was spread out.
Accounts that users can have were ambiguous rather than informational.
We did not find the accessible service throughout the walkthrough.
The UPS site offers a wide variety of customer support options for businesses.

Insights & Recommendations
OVERALL KEY THEMATIC FINDINGS
When concluding the exploratory research phase of our project, we were able to synthesize what we learned across all methods to highlight the key findings about our users and the problem space.
Convenience
MSE’s are generally pressed for time and need to be able to ship out orders efficiently
Reliability
Reliable package tracking & delivery (and the visibility of such) is a key priority for MSE’s
Agency
MSE’s want to maximize control over the entirety of the shipment process
Business Model
Business characteristics dictates their choice of selling and order management platform
USER NEEDS → DESIGN REQUIREMENTS
When concluding the exploratory research phase of our project, we were able to synthesize what we learned across all methods to highlight the key findings about our users and the problem space.
User Needs
Design Requirements
I want an order management platform that centralizes all the information I need, saving me time and offering the most ease of use.
UN1
System should display order management tools on centralized dashboard immediately to user.
DR1
I need to be able to quickly compare shipping rates across shipping services in order for the shipping process to be cost-efficient for me.
UN2
System should allow for straightforward comparisons of shipping rates.
DR2
I need to understand my packages’ status at all times and in a punctual manner.
UN3
The package tracking system data should visualize the package’s journey for users to easily understand and interpret.
DR3
I need to have flexibility with drop off and pick up options to suit my shipment volume.
UN4
System should reorganize claim management guidance to be more transparent and actionable for businesses.
DR4
I want to understand what insurance options will help my business minimize financial losses on claims.
UN5
System should communicate consistently to small business owners about applicable services.
DR5
I want carriers to offer better advertising and branding services that would benefit business growth.
UN6
System should encourage direct interaction with carriers’ online and in-person services in shipping an item.
DR6
I want to learn more about how to build trusting relationships with my carriers.
UN7
System should redesign the pick up process to make it more reliable and safe.
DR7
Design & Build
DESIGN PROCESS
Ideation and Sketching Concepts
With all that we learned from the users and problem space, we began the ideation phase of the design process by prioritizing design requirements through the Must Have (Required), Should Have (Recommended), and Nice to Have (Bonus) Framework. Upon organizing the requirements based on users’ and stakeholders’ priorities individually, we then merged them into one ranking level.


Used Scamper Brainstorm Method to create paper sketches and mapped sketches by “themes” (e.g. tracking visualization, order management). We voted on four core themes and created a sketch for each theme:

DR1
DR2
DR5

DR5

DR3
DR4
DR5

DR1
DR2
DR3
DR5
DR6
DR7
Sketching Feedback Evaluation and Analysis
Information Goals
Identify which sketch is most valuable to prototype from expert perspective
Participant Demographics/Recruitment
Semi-structured interviews with expert HCI peers (2nd yr students), UPS UX researchers
Participant answered questions & scored each sketch
Method of Analysis
Affinity map of participant & stakeholder feedback
Evaluation matrix to systematically decide on final concept to wireframe
Notable Findings
One of the main wireframe workflows should be a widget-based, personalized dashboard
Expert Request: Develop a “create a shipment” workflow in wireframe with smart recommendations

Wireframing
With two final concepts to proceed with, we began producing mid-fidelity wireframes:

Widget-Based Dashboard
Redesigned dashboard that incorporates editable widgets that allow users to manage incoming/outgoing orders, claims, returns as well as have access to in-store services and shipping supplies from UPS.
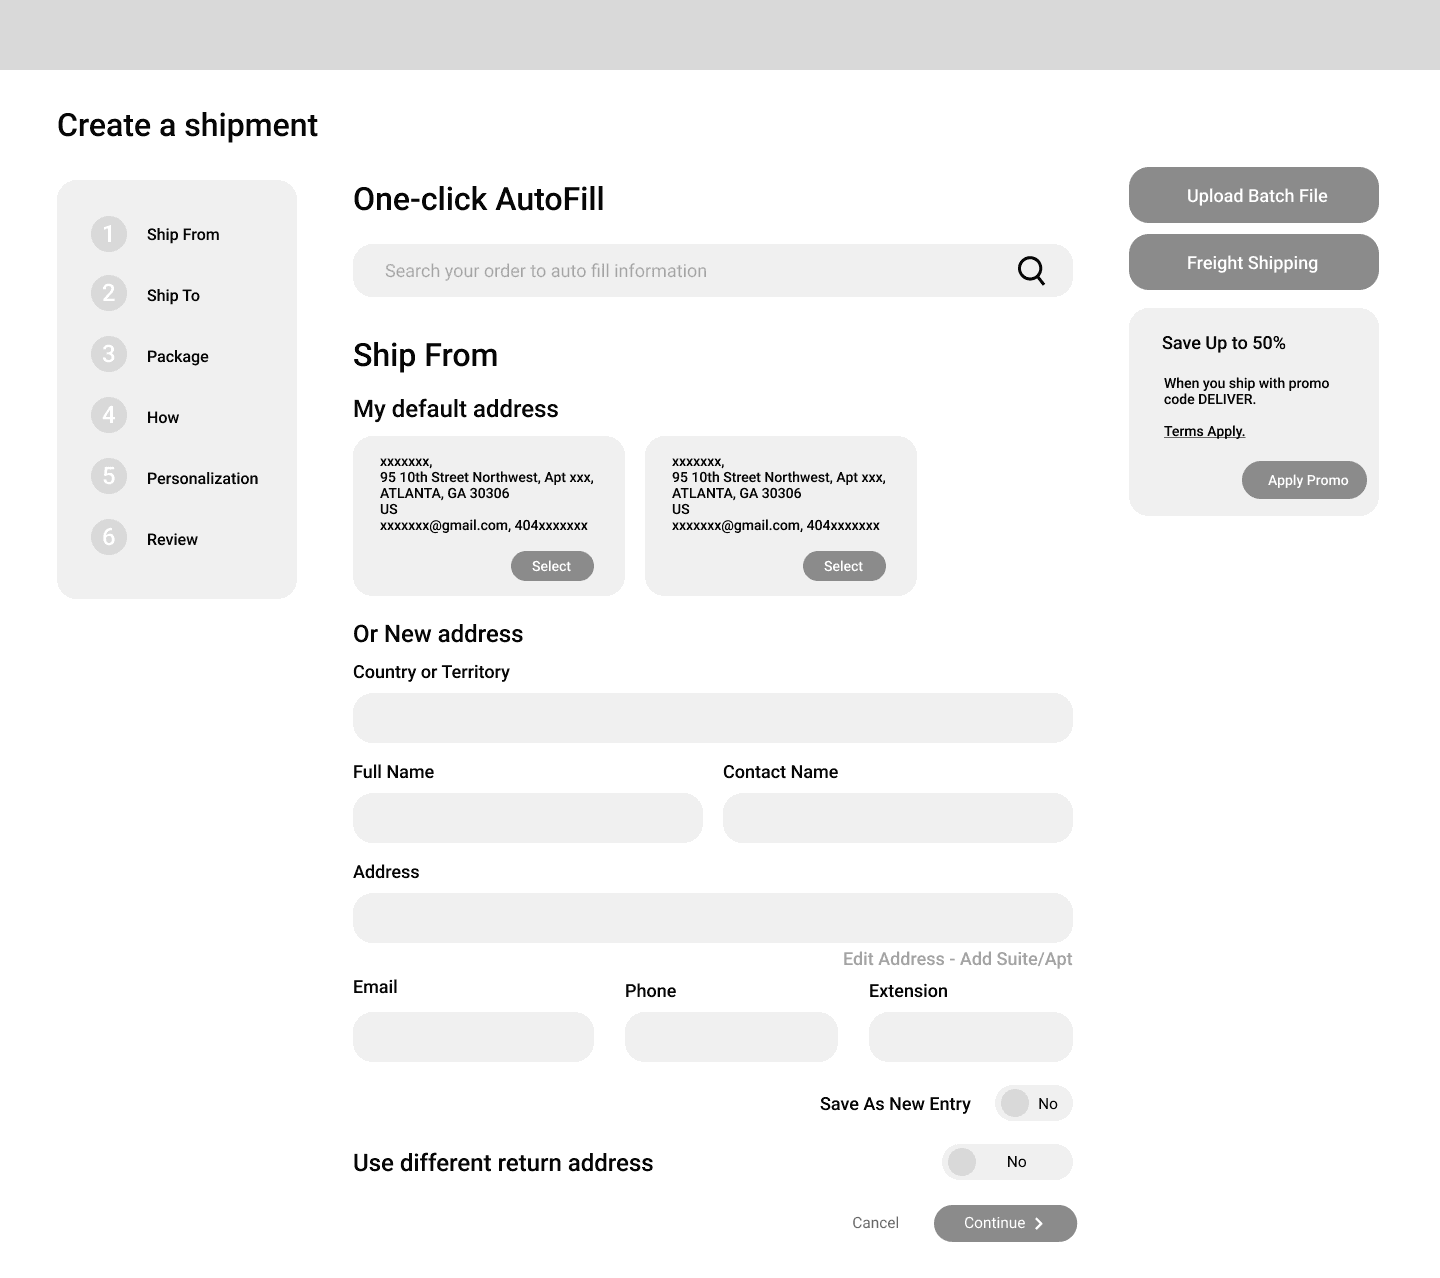
“Create a Shipment” Workflow
Redesigned shipping flow where system can autofill shipment details based on past shipment preferences and history as well as offer smart, predictive recommendations for shipment services & package options.
Once wires were at a good point for both flows, we decided to test with users and our stakeholders to understand their usability and potential value to ultimately determine which we will proceed as our main design choice.
Wireframe Feedback Evaluation and Analysis
Information Goals
Evaluate relevance and usability of “Create a shipment” and dashboard wireframes
Participant Demographics/Recruitment
Think-aloud & cognitive walkthrough with 2 MSE owners representing each persona
Process
Evaluated on wireframe tasks, post-task questions (SEQ + rating scale), SUS, and wrap-up interview
Method of Analysis
Affinity map to extract themes from both tasks
Descriptive statistics for rating scale questions
Scoped wireframe based on stakeholder & group constraints
Notable Findings
Widgets should be able to convey functionality and possible interactions (e.g. adding/deleting widgets) without explanation

Widget-based dashboard selected as high-fidelity prototype concept
Hi-Fidelity Design & Prototype
With the dashboard design being the final direction to take, we proceeded with building out the UX and UI design in full - making it functional enough to later test its usability.

Evaluative Research & Validation
Moderated User-Testing
Heuristic Evaluation
Heuristic Evaluation
Information Goals
Understand what design decisions improved and hindered usability
Process
Evaluated prototype on Nielsen’s Heuristics for three tasks
Selected 6/10 heuristics based on relevance to prototyped interactions
Method of Analysis
Analyzed evaluation data using affinity map
Extracted expert evaluation findings on usability by task
Findings
System must enhance visibility of features that the user would benefit from
System should promote independence in customizing the dashboard to fit users’ needs
Outcomes
Changes were made to the high fidelity design before testing with users that:
Highlighted critical information and avoided overload
Enhanced flexibility and efficiency of use
Improved recognition and recall
Made visibility of status more intuitive
And more!
Participant Demographics/Recruitment
2 UPS UX researchers, 1 MS-HCI 2nd year student
Outcomes & Project Learnings
Project Outcomes
Upon wrapping up the project, our final deliverables were shipped to the client for reference and consideration in future iteration initiatives.
What I Learned
Have and Record Rationale
It is important to have a rationale to every method or choice used when going through the research and design process.
Understood and Applied Research Methods
Learned about various research methods and when it is best to use them
Benefits of Teamwork
Learned how teamwork can offer the opportunity to uncover other ways of approaching information and provide more information that was not considered before.
